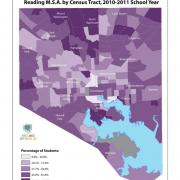
Where are "the lines between us" in Baltimore City in terms of which children get placed in special education programs, who arrives ready for Kindergarten, who's moving from school to school most often, who's absent from elementary school, and who's getting suspended?
All of the "Lines Between Us" maps are now in one interactive application, searchable by address.
How fair is housing in our region? Find out by exploring this rich interactive map from the U.S. Department of Housing and Urban Development. Then put your two cents in on HUD's new proposed fair housing rule--the public comment period ends September 17.
What parts our our region have the most residents without a high school diploma? Find out with this new map from the Baltimore Neighborhood Indicators Alliance.
Our new map from the Baltimore Neighborhood Indicators Alliance shows the home addresses of Maryland prisoners.
These new maps from the Baltimore Neighborhood Indicators Alliance show the level of property, drug, juvenile, and violent crime neighborhood by neighborhood.
If a debt collector takes you to District Court and you miss two orders to appear, you can be arrested--and, if you can't afford the bond, jailed. We have county-by-county numbers on arrests and jail time, and Baltimore County is in the lead.
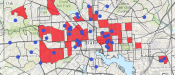
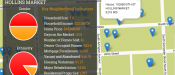
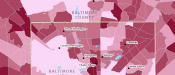
In Baltimore, the National Day of Civic Hacking produces some tools to highlight and alleviate inequality, including homeless services plotted on a map with free transportation lines and a map of vacant houses crossed with neighborhood socioeconomic data (seen here).
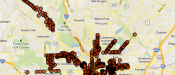
Episode #26 deals with inequality and surveillance--specifically, where these cameras are located and how they are used. Is life different in the "blue light zones"?
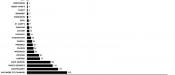
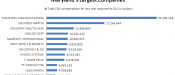
What are CEOs getting paid at some of Maryland and Baltimore's largest publicly held companies? Are their shareholders giving executive pay packages a thumbs-up or a thumbs down? And what are average workers making in comparison to the boss?
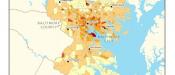
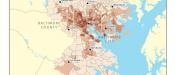
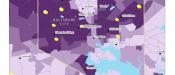
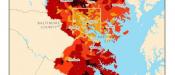
The number of Maryland households in the federal Supplemental Nutrition Assistance Program (SNAP, aka "food stamps") more than doubled between 2008 and 2012. In this map, you can see where food stamp use is greatest in the Baltimore region.
Check out our animated map of income segregation in the Baltimore region. The map moves from 1970 to 2009, and as middle class neighborhoods vanish, poor and affluent ones take their place.
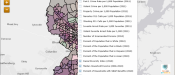
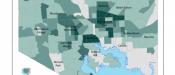
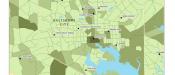
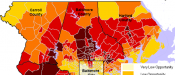
A researcher took data on education, the economy, and neighborhood health and created a map that highlights the Baltimore region’s “communities of opportunity.” We break down the map to see where the most opportunities are.
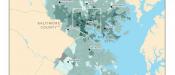
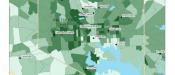
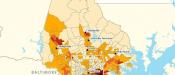
This new map from the Baltimore Neighborhood Indicators Alliance shows the number of paid positions per Census tract. The darker the splotch on the map, the more jobs.
How does unemployment break down by Census tract in the Baltimore region?
What are folks making in your neighborhood? How does it compare to other parts of our region? And how has it changed over the past decade.
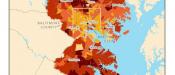
Take a look to see how Baltimore's foreclosure hotspots play out across the city's landscape of race and class. We've merged data from ProPublica's random sample of Baltimore foreclosure filings with Baltimore Neighborhood Indicators Alliance's maps of both Baltimore's African-American population and median household income.
How do YOU think income levels changed in the Baltimore region between 2000 and 2010?
Last week we mapped racial diversity in the Baltimore region. Now see the maps for the region's population by race.
How diverse is your neighborhood?
Take a look at a map of the Baltimore region's âcommunities of opportunity,â and see if you live in one.